How To Deal With Uneven Agile Adoption Rates

![[PHOTO] - Kevin Miller](/images/people/KevinMiller.jpg)
![[PHOTO] - Tommy van Schaik](/images/people/TommyVanSchaik.jpeg)
Mobile users: Jump to the Quick Takeaways
This article was published via Built In.
Welcome to part two of our advice series exploring how to avoid wagile scenarios (or recover from them if they sneak up on you).
Simply put, wagile is the worst. It’s a mashup of the agile and waterfall methodologies, and many think this hybrid approach provides the best of both worlds. In reality, it creates chaos and confusion, which — to put it bluntly — ruins effective project management. If you have a wagile scenario to share, please send it to experts@builtin.com, and we’ll take a look.
Mixing Methodologies
Hi Kevin and Tommy,
My question is related to the rate of agile adoption in different teams. I work for a large organization in the automotive industry with multiple product groups. Some of the larger agile teams are organized as SAFe agile release trains, while others use agile team practices (Scrum and occasionally Kanban).
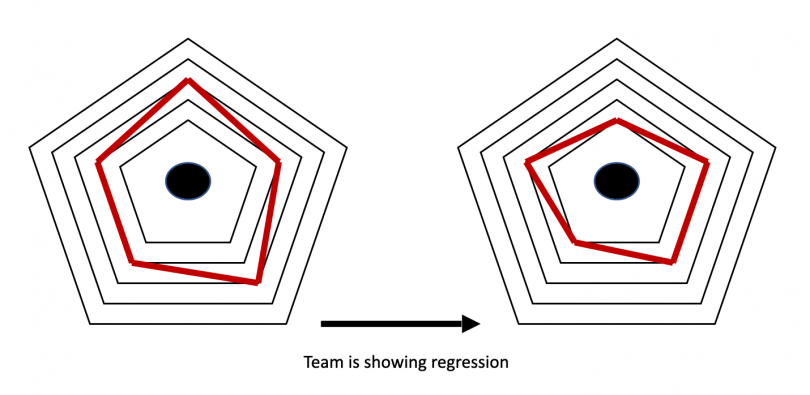
We noticed a significant difference in the agile adoption rate between the different product groups. Some of them are at a high maturity level and improving rapidly, while others seem to show slower progression — we update a maturity radar chart every three months. How can we make sure all of our teams increase adoption and velocity and become more effective?
Cheers,
Gardu
Tailor Agile Adoption to the Product's Digital Components
Hi Gardu,
Measuring agile maturity between different teams is as much of a challenge as measuring the effectiveness of more classical team compositions.
First, it’s important to realize that the adoption and effectiveness of agile practices depends heavily on the products the teams are working on. Some teams will be slower in their adoption simply because agile is less applicable to them. In a large and complex organization like yours, it is likely that many different teams are working on many different products. The nature of these products have a high impact on the effectiveness of agile. In general, one could say, “The more digital the product, the more effective agile will be.”
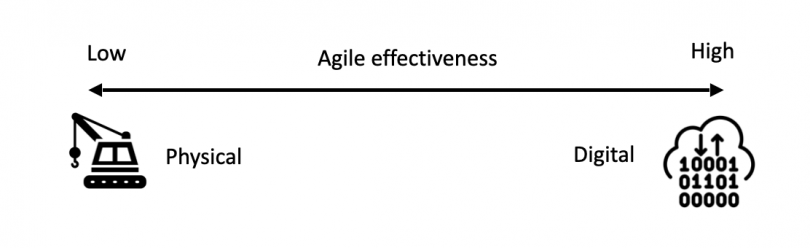
When you look at classical examples of successful agile implementations (Spotify, Netflix, banks, insurance companies, etc.), you’ll see they all have an end-product that leans heavily to the right — and is based one ones and zeros.
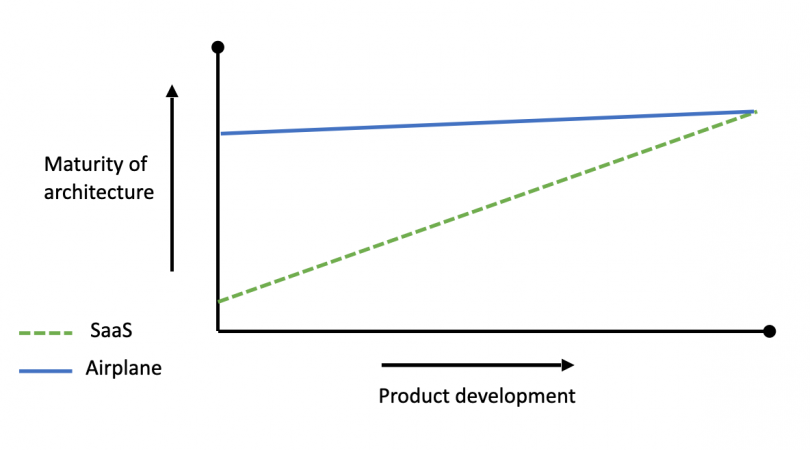
The reason for this lies in so-called “emergent architecture,” which is the amount of architecture you need up front to ensure you end up with a sustainable product in the end. For example:
- Most SaaS companies probably give some thought to the architecture of their software early on, but most of the architecture will be created as they are programming.
- If you are creating something more on the left side of the scale — let’s say an airplane — all of the components need to fit perfectly, and they cannot be manipulated while the airplane is being put together because the cost of changing components mid-build would be devastating. That’s why these types of products require up-front architecture.
On a graph, it looks like this:
Some companies have become adept at dealing with products that have large up-front architecture, and they have perfected the art of breaking them down into smaller components, some of which are more suitable to being created in an emergent-architecture approach (e.g. the software used in the aircraft).
When a large and complex product consists of both physical and digital components, it is critical for organizations to tailor their agile implementation to only the digital components of the product and not the entire product, since implementing agile on the physical components leads to becoming wagile!
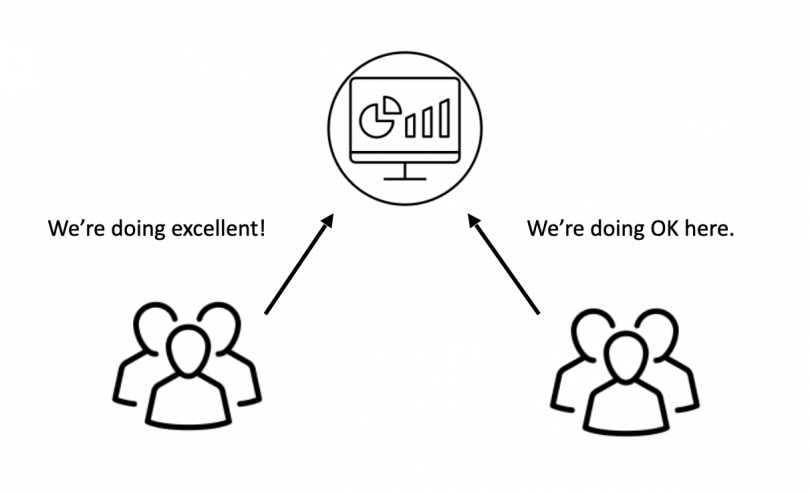
Since the product matters when analyzing agile adoption in teams, it’s hard to compare progress between different teams. We can, however, apply a relative performance measurement to each of the teams by comparing them against themselves.
Much like relative estimation and velocity used in agile’s planning poker process, we can apply the same thought process to the relative performance measurement.
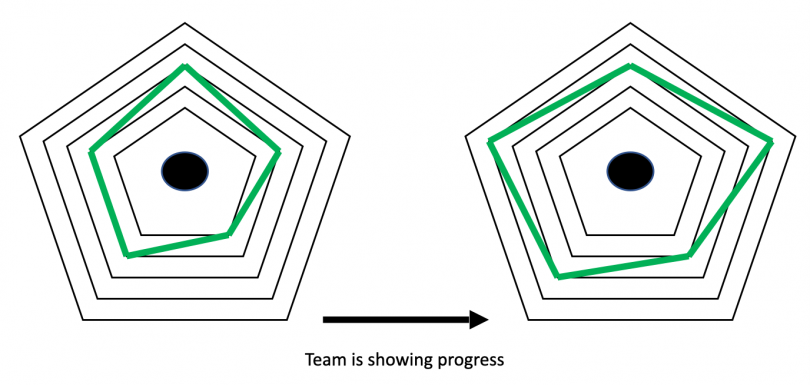
The radar charts you are using are excellent for this; it is good to assess relative team performance over time. Keep in mind that the specific metrics measured by the five points of these spiderwebs can vary between organizations, departments and teams. It's the conceptual practice that matters here.
4 Tips for Assessing the Adoption Rate of Teams
In our experience, there are a few key things to keep in mind when helping multiple teams effectively adopt an agile methodology without straying into wagile territory:
- Don’t tie the performance of a team to their adoption of agile.
- The applicability of agile depends in large part on the nature of the product.
- Measure the agile adoption rate of a team with a relative performance matrix.
- Comparing agile adoption rates between different teams is tricky and can lead to distorted conclusions.
Quick Takeaways
Problem Summary: Measuring agile adoption rates among teams can be a trap if not done properly.
Solution Summary: Measure the agile adoption rate of "digital" teams with a relative performance matrix, and don't compare teams.
Built In Link: How To Deal With Uneven Agile Adoption Rates
Quote: “The more digital the product, the more effective agile will be.”